Simply watching your account balance rise and fall won’t tell you why your investments are working—or not. To make informed decisions, you need a clear process for measuring returns, quantifying risk, attributing sources of performance and comparing results to benchmarks. This roadmap lays out an eight-step method to turn raw data into actionable insights.
1. Set Clear Goals and Pick a Benchmark
Every evaluation starts with understanding what you aim to achieve. Clarify:
- Time Horizon: Short-term traders may track monthly performance, while long-term investors look at annualized gains.
- Return Target: Are you shooting for 6% per year, or competing with an index like the S&P 500?
- Risk Tolerance: Can you handle a 20% drawdown, or do you need to limit losses to 10%?
Select a benchmark that matches your style: an equity fund might use the MSCI World Index, a bond-heavy mix could use the Bloomberg Aggregate, and a custom blend reflects your exact allocation.
2. Collect Your Data Systematically
Accurate records are essential. For each account, gather:
- Dates and amounts of deposits/withdrawals
- Buy/sell trade details (ticker, price, quantity)
- Income entries (dividends, interest)
- Fees and expenses
Use a spreadsheet or automated tools—like portfolio trackers that sync with your broker—to compile a table of transactions and daily values.
3. Calculate Basic Return Metrics
Start with these fundamental measures:
- Total Return: ((Ending Value + Income – Beginning Value) ÷ Beginning Value) × 100
- Annualized Return: Converts multi-year growth into a constant yearly rate.
- Time-Weighted Return (TWR): Neutralizes the effect of cash flows by breaking the timeline into segments around each deposit/withdrawal and compounding sub-period returns.
- Money-Weighted Return (IRR): Solves for the rate at which net present value of all cash flows and ending value equals zero—reflecting your personal experience.
4. Measure Volatility and Downside Risk
Returns need context. Evaluate how choppy results were with:
- Standard Deviation: Spread of periodic returns around the average.
- Maximum Drawdown: Largest peak-to-trough decline in value.
- Downside Deviation: Focuses on negative returns only.
- Value at Risk (VaR): Estimated worst expected loss over a specific period at a given confidence level.
5. Compute Risk-Adjusted Ratios
Gauge efficiency by relating returns to risk:
- Sharpe Ratio: (Portfolio Return – Risk-Free Rate) ÷ Standard Deviation
- Sortino Ratio: (Portfolio Return – Risk-Free Rate) ÷ Downside Deviation
- Information Ratio: (Portfolio Return – Benchmark Return) ÷ Tracking Error
6. Attribute Performance to Allocation and Selection
Break out your excess return above the benchmark into:
- Allocation Effect: Value added (or lost) by your weights in each asset class.
- Selection Effect: Returns earned (or missed) from picking specific securities.
- Interaction Effect: Combined impact when allocation and selection align or conflict.
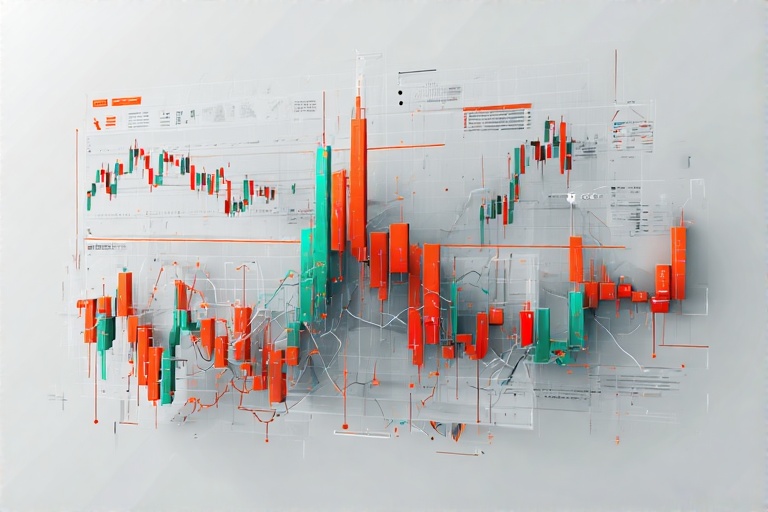
7. Visualize Your Data
Dashboards make insights pop. Key visuals include:
- Cumulative portfolio vs. benchmark growth
- Rolling returns (e.g., 12-month)
- Drawdown curve highlighting recovery periods
- Asset allocation drift vs. targets
Tools like Google Data Studio, Tableau or Excel with dynamic charts can refresh automatically from your data source.
8. Establish a Review and Rebalancing Routine
Set a calendar for analysis:
- Monthly: Update performance and risk metrics.
- Quarterly: Review allocation drift and rebalance positions that exceed tolerance bands.
- Annually: Reassess goals, benchmarks and strategy parameters.
When rebalancing, trim overweight areas and redeploy into underweight segments or use fresh contributions to realign weights and manage tax implications.
Examples of Insights …
- A diversified fund outperformed its 60/40 benchmark by 0.9% annualized over five years, driven by an allocation effect from a 10% tech tilt.
- An equity sleeve posted 18% annualized return but had a 22% standard deviation, resulting in a Sharpe ratio of just 0.8 and prompting a shift into lower-volatility sectors.
- After a 16% drawdown, a timely rebalance rotated 5% from battered cyclicals into defensive staples, reducing subsequent drawdown severity by 4%.
Conclusion
Effective portfolio tracking ties returns to risk and decisions. By defining objectives, systematically collecting data, computing both basic and risk-adjusted metrics, attributing performance drivers, visualizing trends and enforcing a disciplined review and rebalancing schedule, you maintain control over your investment journey. This structured approach empowers you to spot issues early, capitalize on strengths and continuously refine your strategy.


Add a Comment